Context
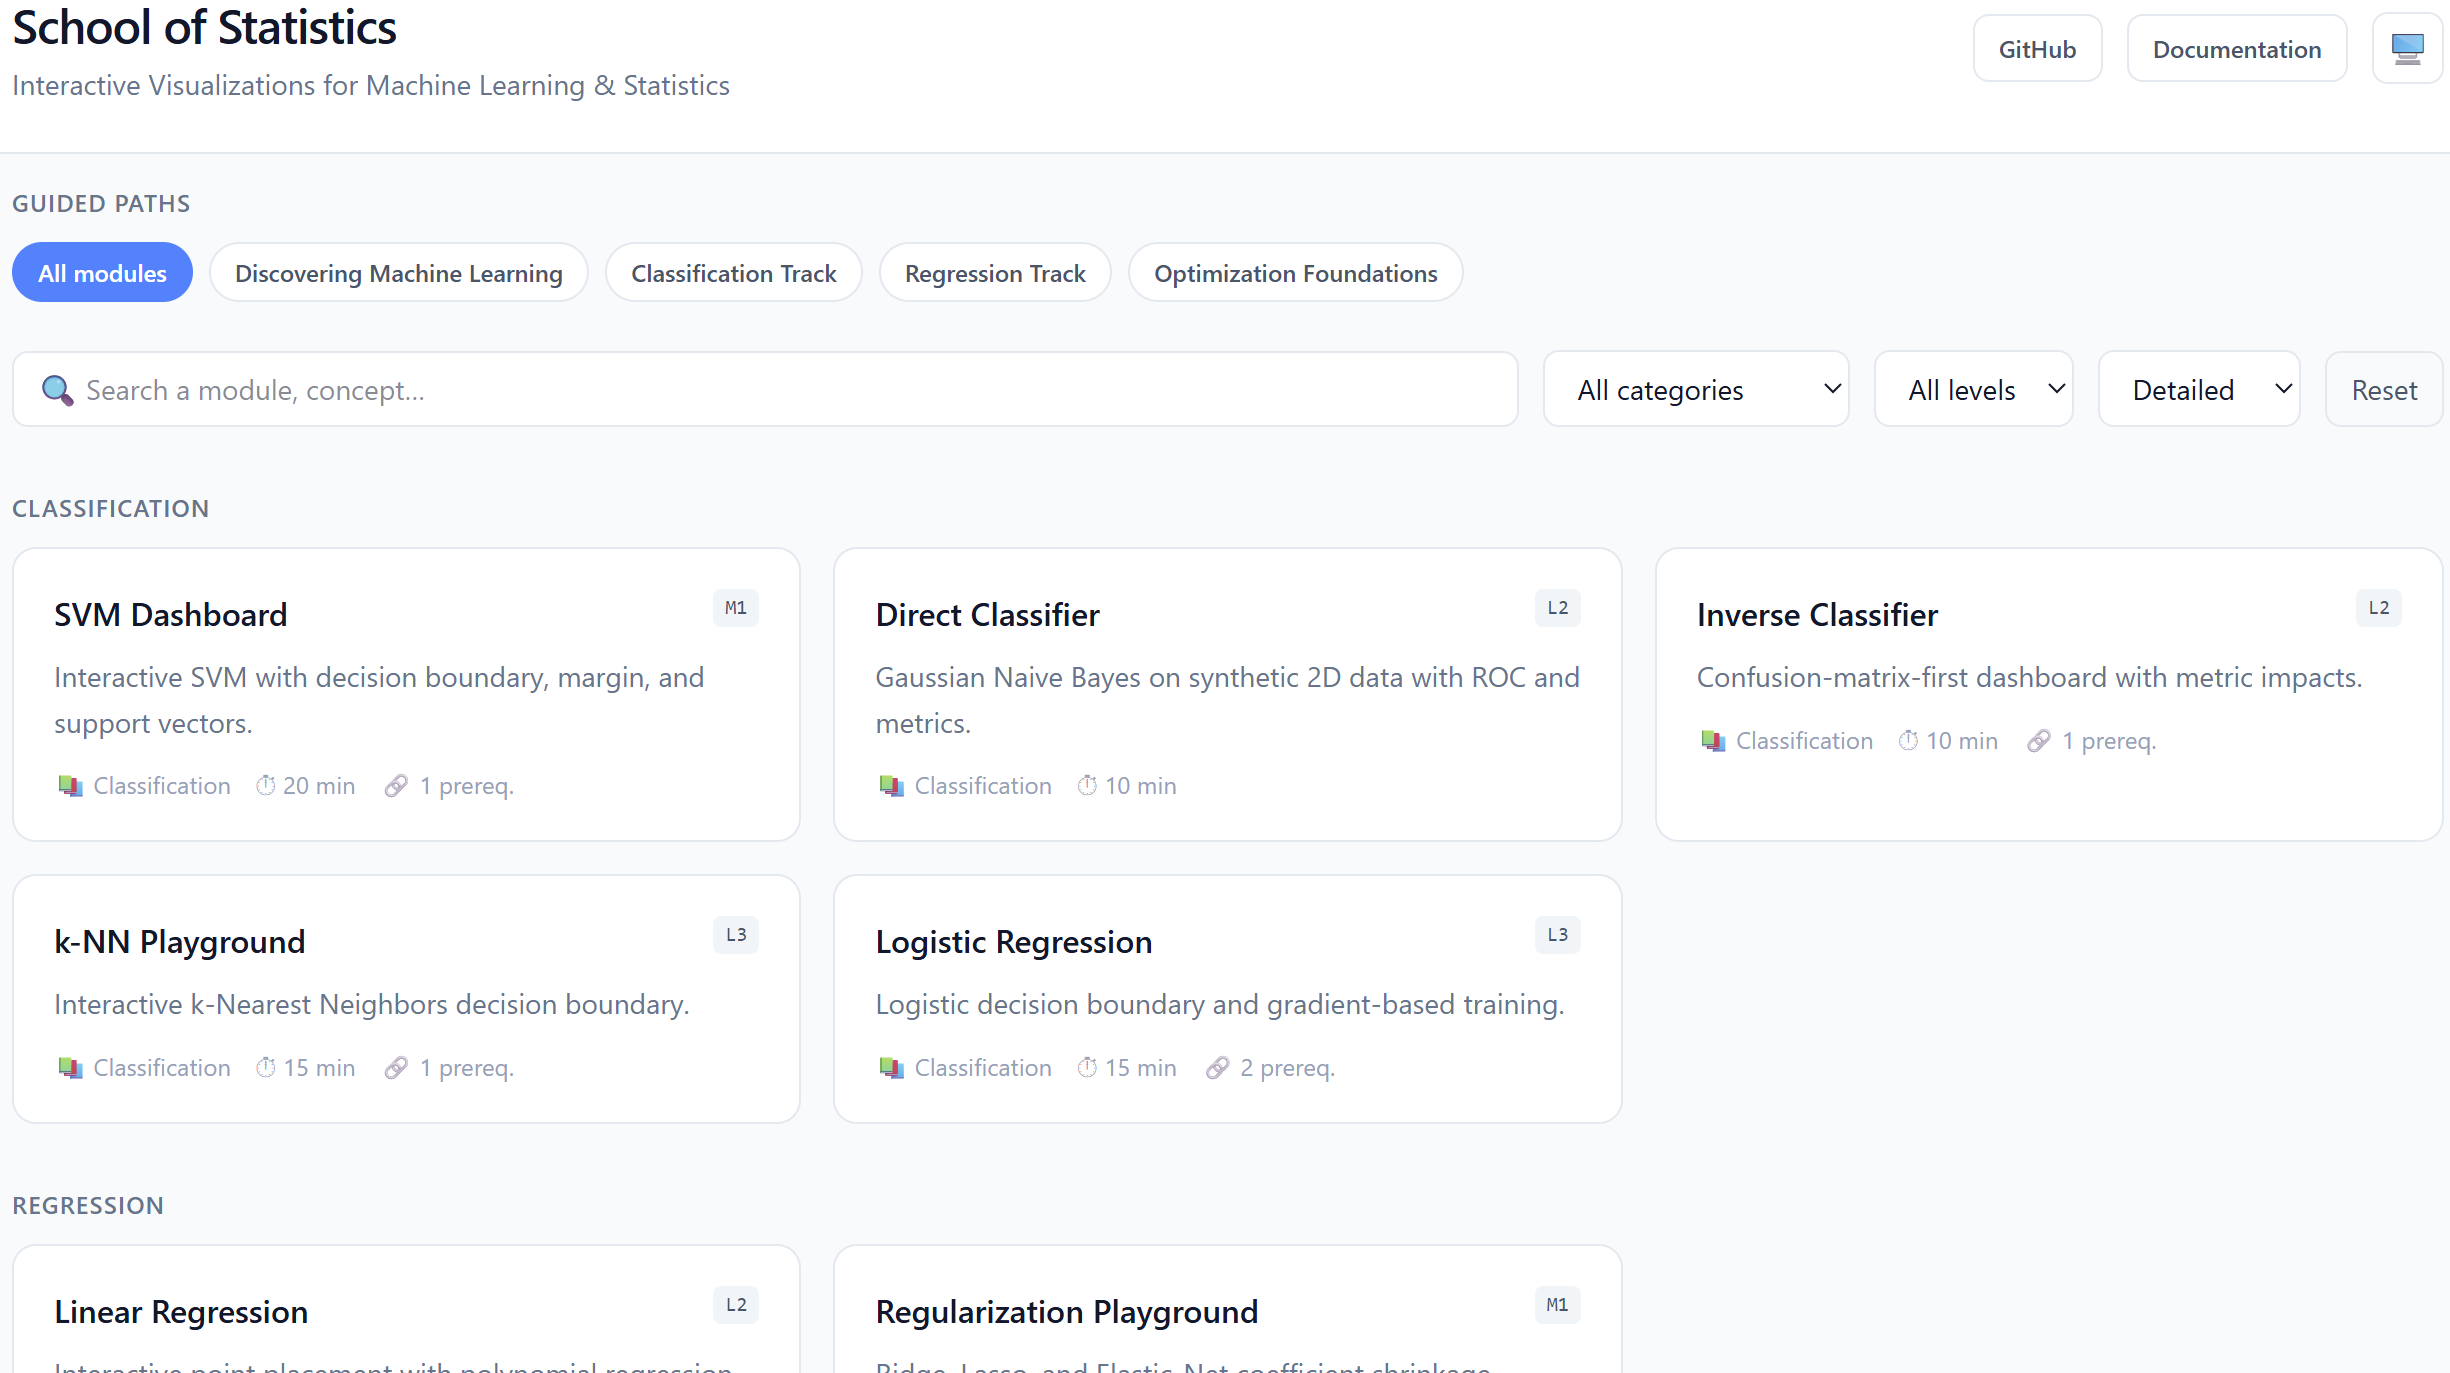
School of Statistics (SOS) is an educational platform offering interactive, browser-based visualizations designed to make statistics and machine learning concepts accessible. It allows users to visually experiment with mathematical formulas and algorithms without requiring a local installation or backend server.
Challenge
Statistics and machine learning concepts are often presented using abstract formulas or static graphs, which can be difficult to grasp for students, mentors, and non-specialist professionals. Traditional educational tools typically require setting up development environments (like Python or R) or running complex servers, creating a barrier to entry for quick visual experimentation. Additionally, making these visual tools highly performant, responsive, and accessible directly in the browser presents significant frontend implementation challenges.
Approach
To solve these challenges, the platform is built as a static client-side application using TypeScript and modern bundlers. The user interface runs entirely in the user’s browser, eliminating server dependency and ensuring private, instantaneous computation.
- Client-Side Computation: all mathematical calculations, data generation, and algorithm simulations are performed directly on the client using optimized core math modules.
- Interactive Visualizations: high-performance charts are rendered using
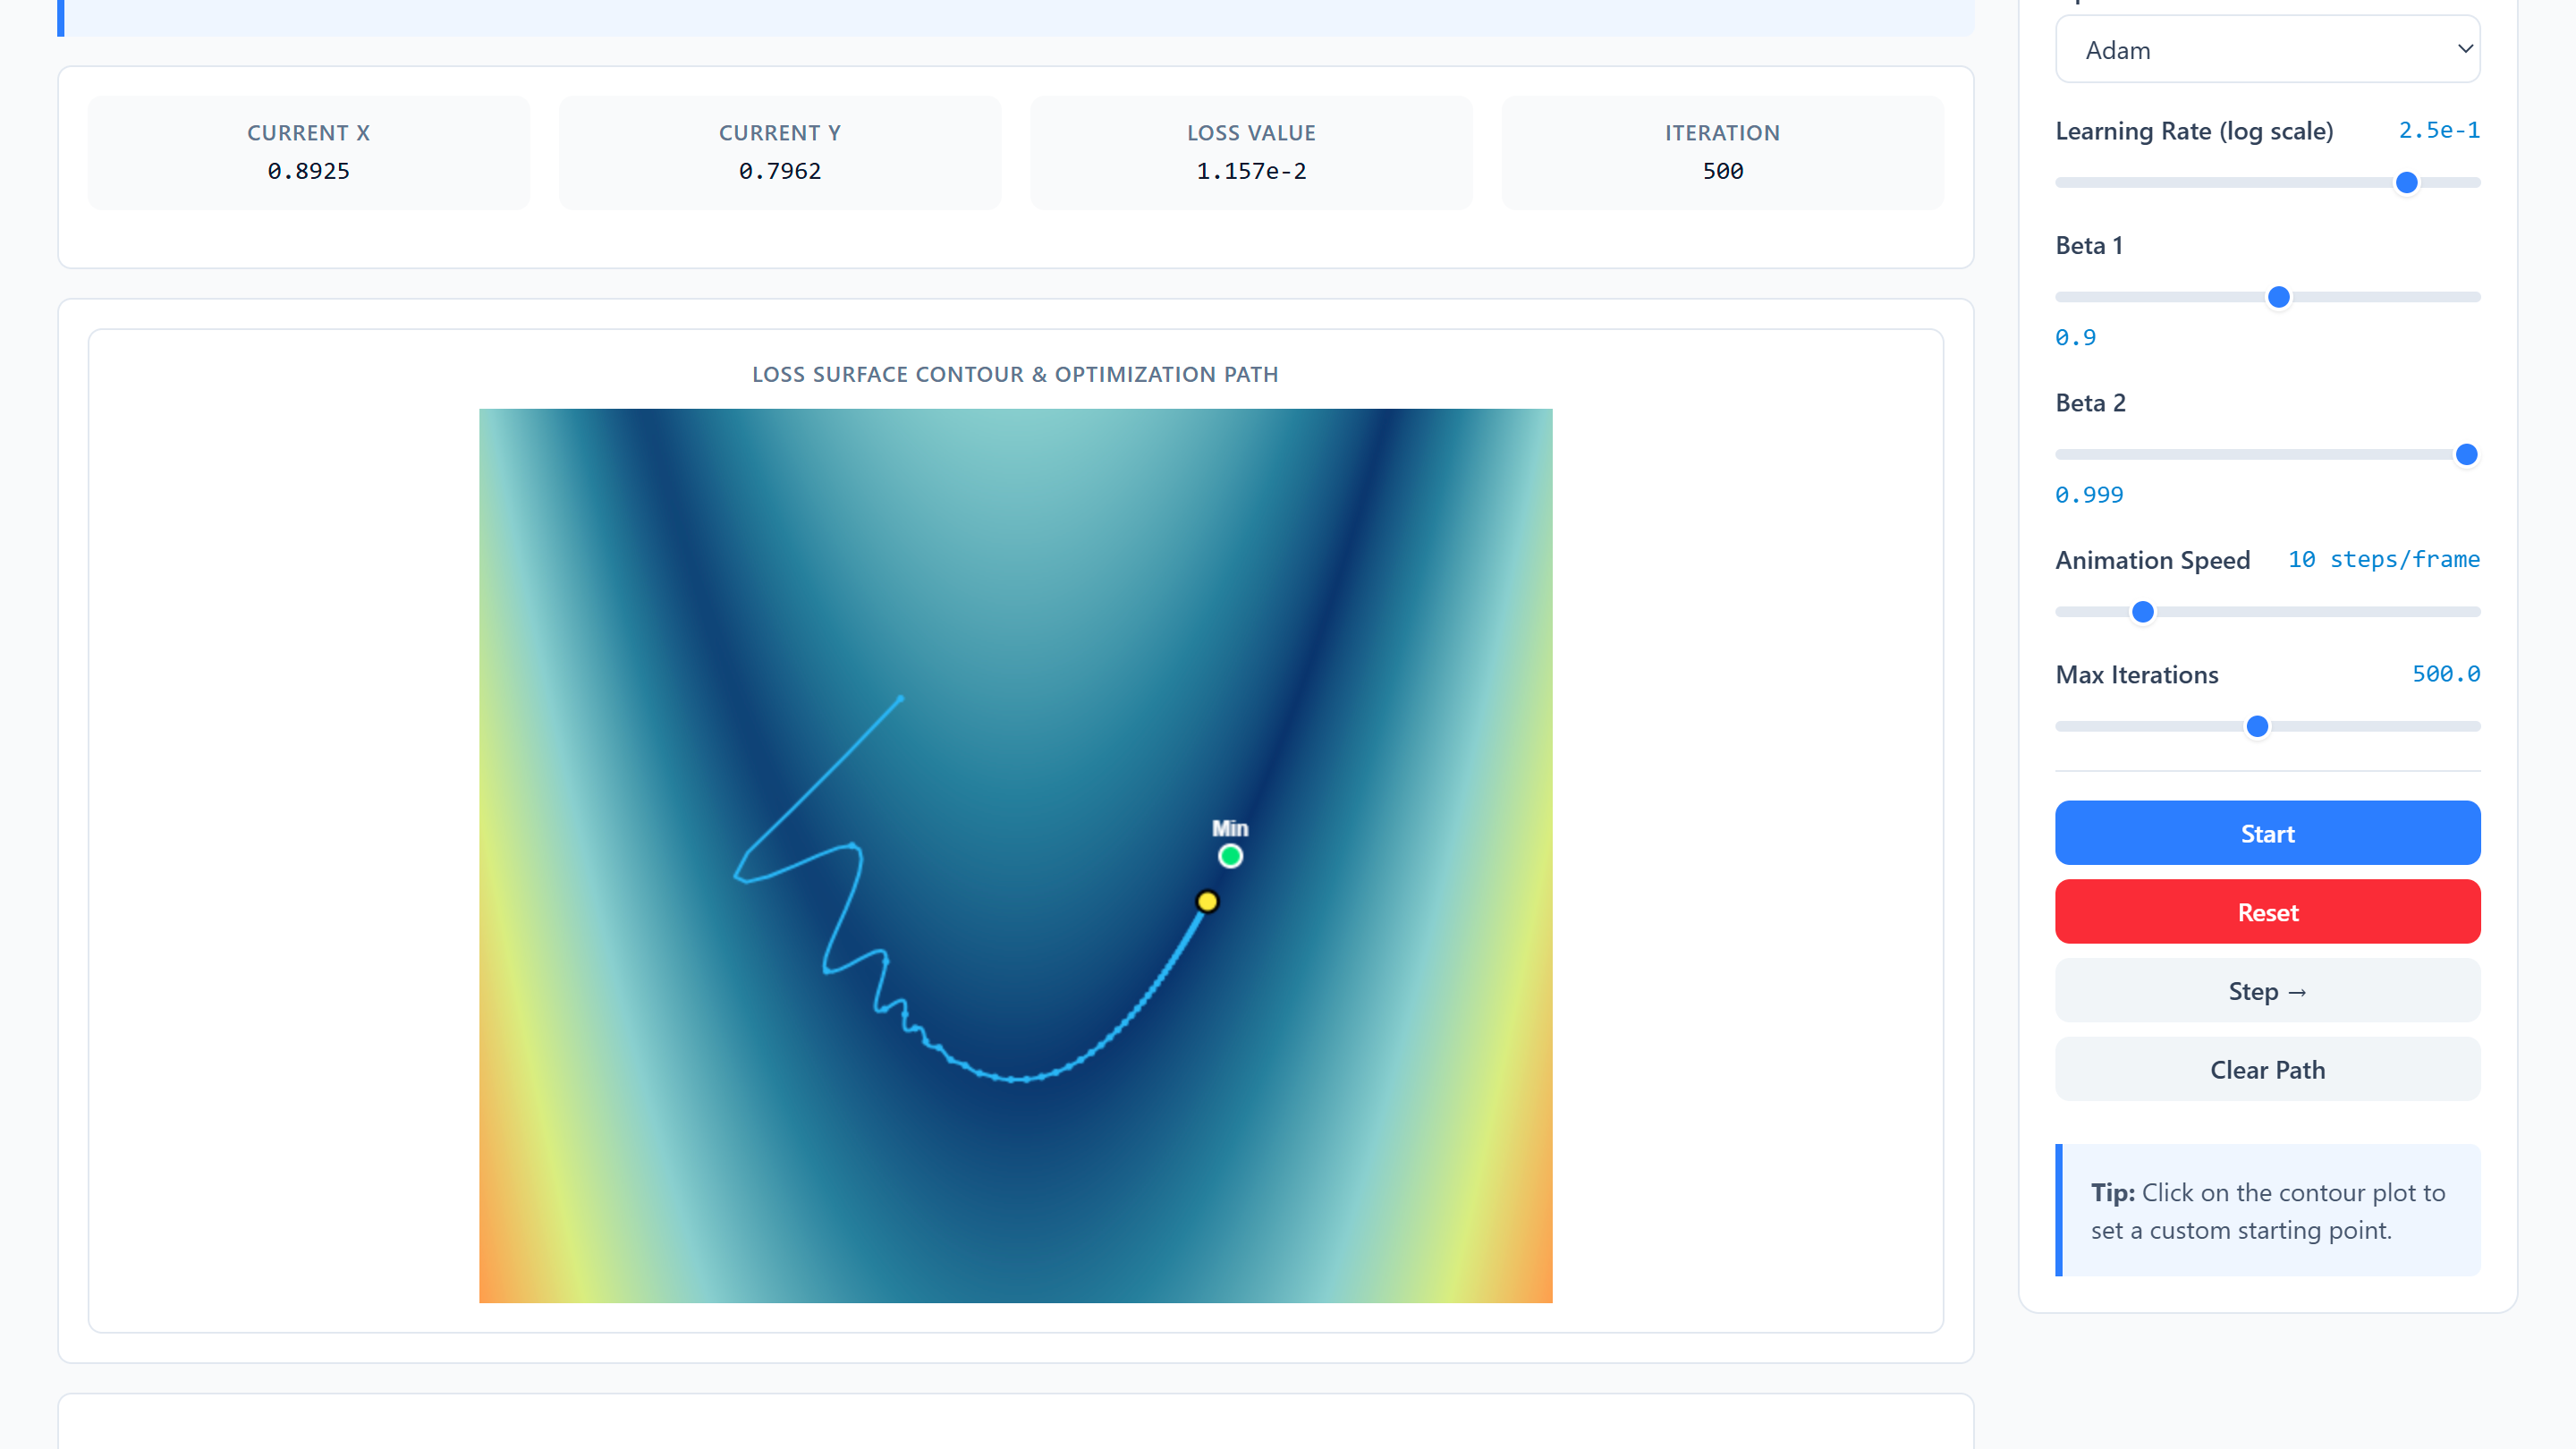
Chart.jsandD3.js, enabling drag-and-drop operations, real-time dataset manipulation, and immediate visual feedback. - Accessibility and Usability: standard semantic HTML elements, cyclic dark mode, and full keyboard navigation ensure compliance with web accessibility standards (WCAG 2.1).
Features
- Direct Classification: real-time visualization of a Gaussian Naive Bayes classifier on synthetic 2D datasets. Users can adjust class separation and spread to immediately observe impacts on the ROC (Receiver Operating Characteristic) curve, Area Under the Curve (AUC), confusion matrix, and standard classification metrics (accuracy, precision, recall, specificity, F1-score).
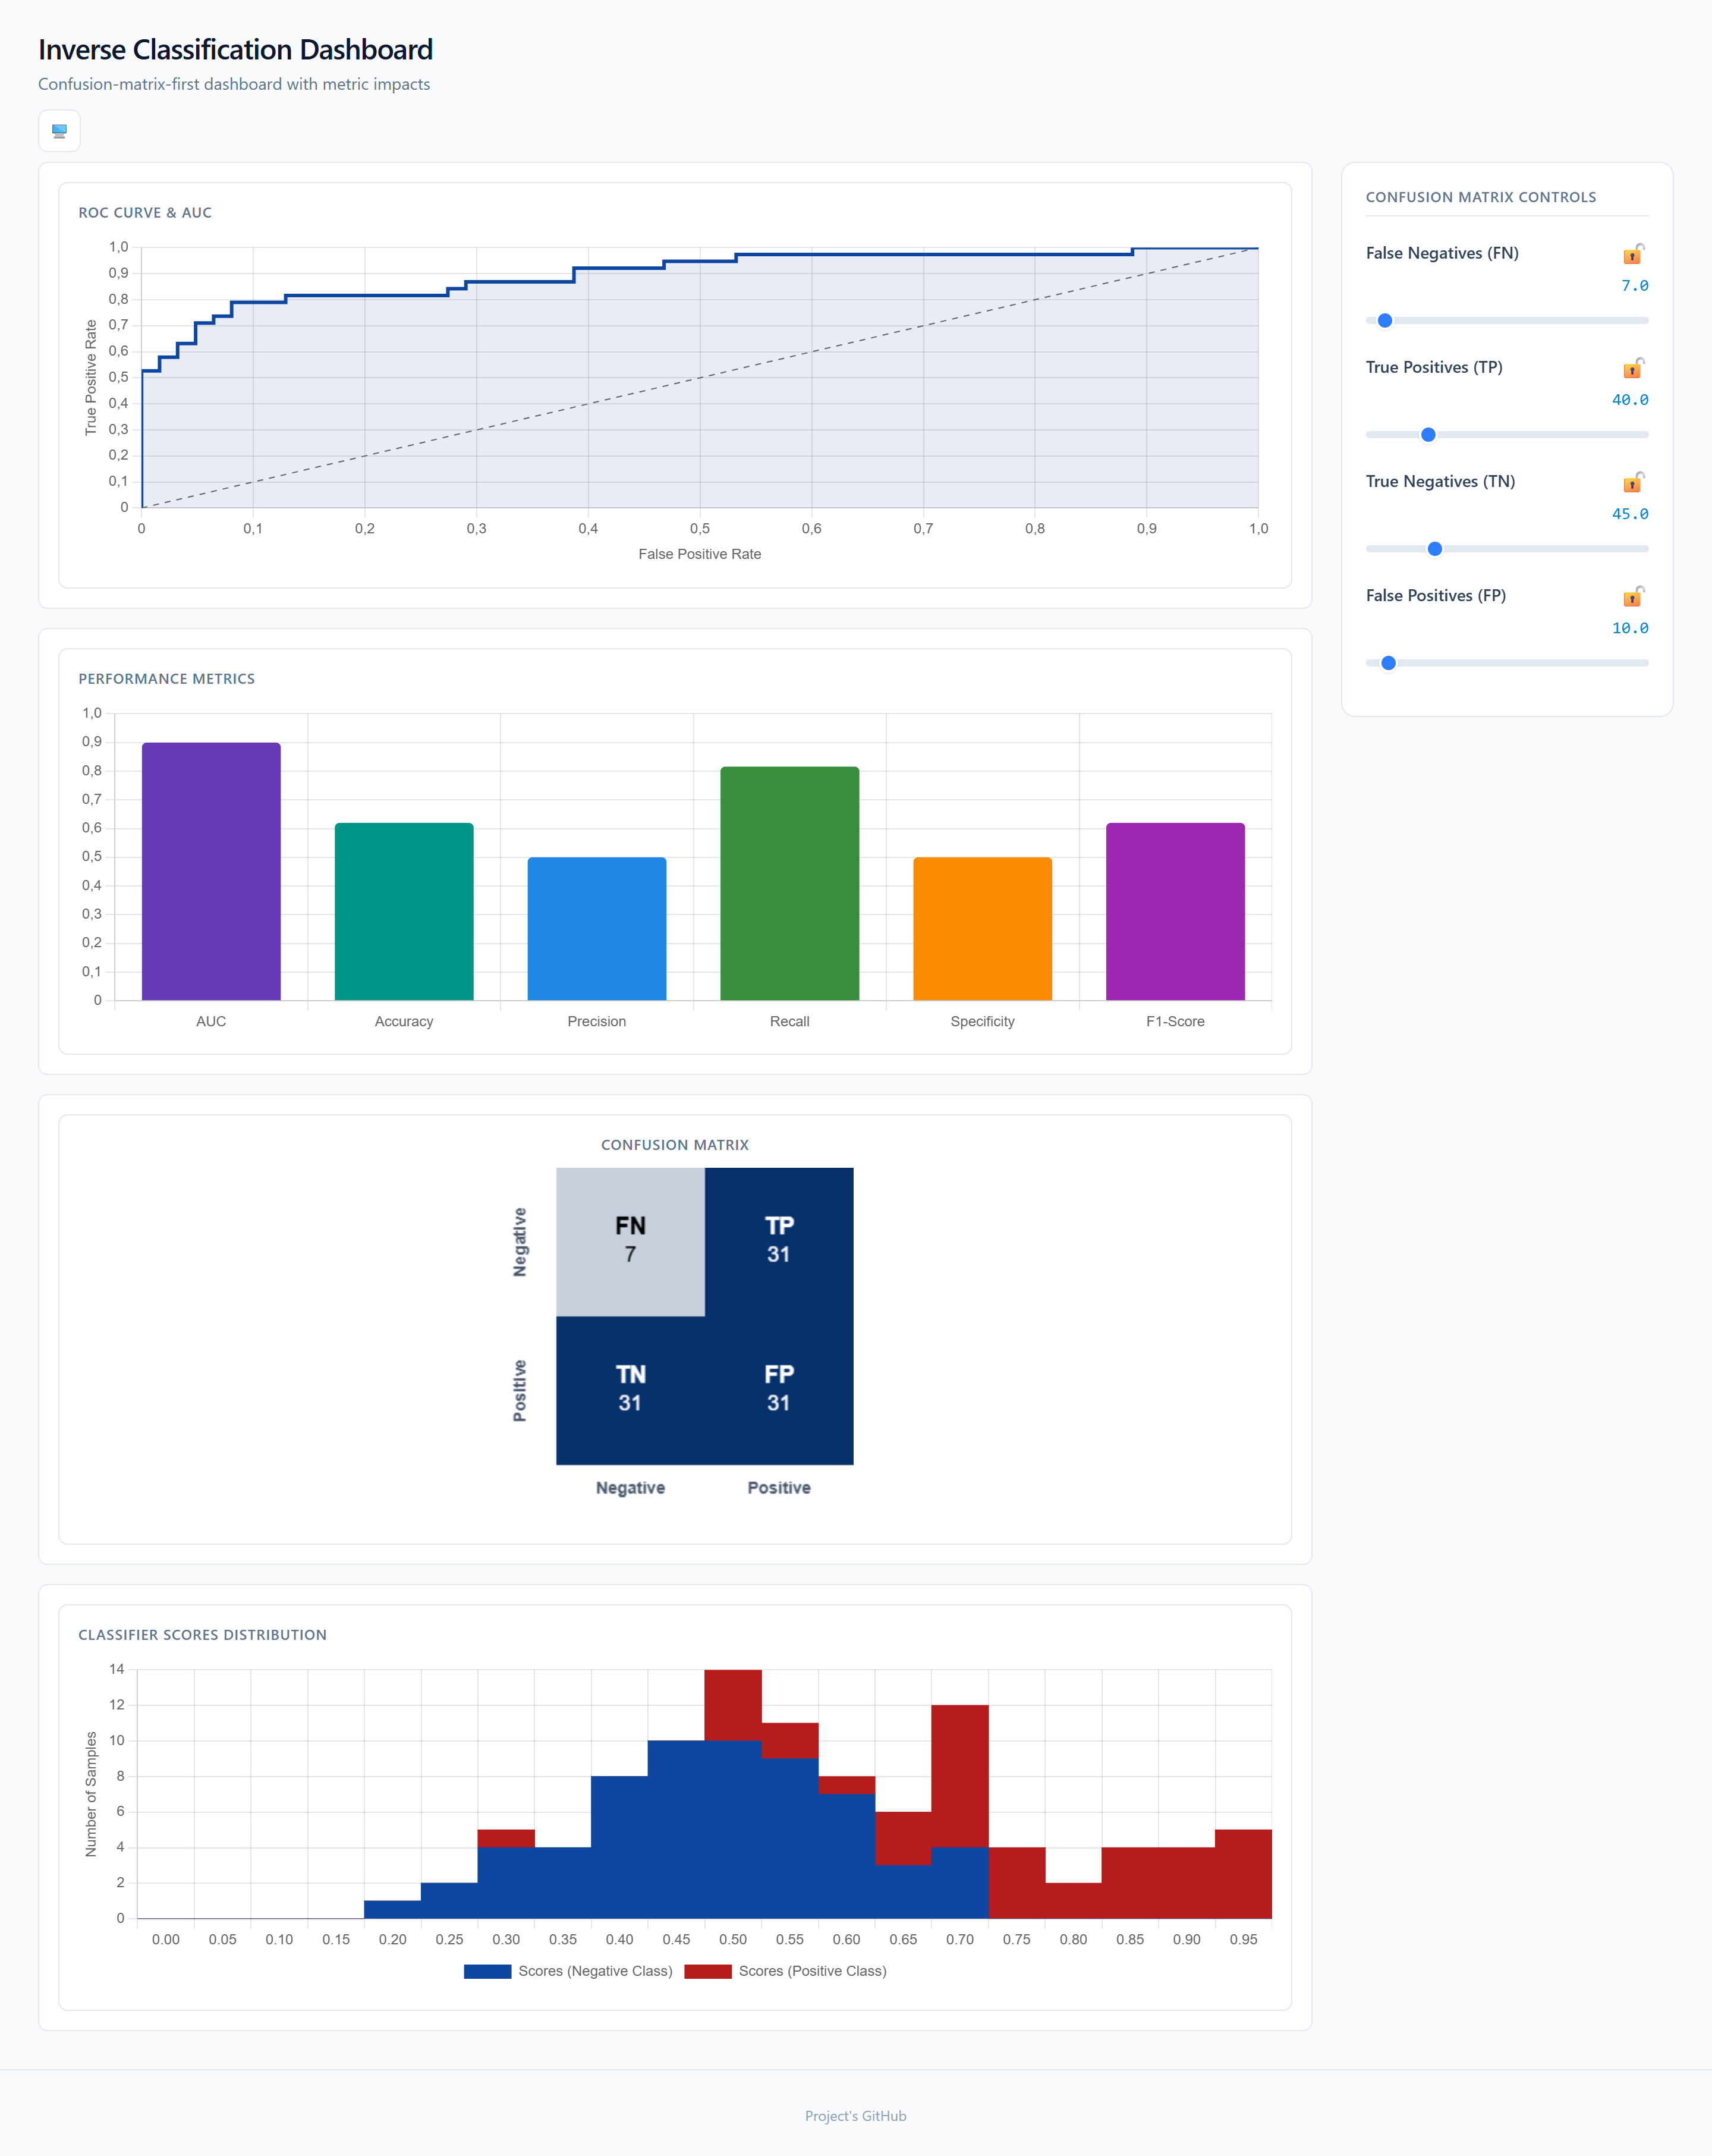
- Inverse Classification: interactive simulator allowing users to directly modify confusion matrix parameters (True Positives, False Positives, True Negatives, False Negatives) to understand their influence on resulting performance metrics and score distributions.
- Support Vector Machine (SVM): playgrounds illustrating support vector classification, margin maximization, and decision boundary sensitivity when adjusting the regularization parameter $C$.
- Linear and Polynomial Regression: interactive canvas enabling users to place and drag points, automatically fitting regression models of degrees 1 to 10. Displays confidence intervals, residuals, and the coefficient of determination ($R^2$).
- Fourier Transform: interactive visual composition of complex signals from up to four distinct sine waves. Generates real-time visualizations of time-domain signals, magnitude spectrums, and phase spectrums.
- Other Playgrounds: visualizations for k-Nearest Neighbors (k-NN) classification, Ridge and Lasso regularization path analysis, and Principal Component Analysis (PCA) step-by-step projection.
Outcome
The project provides a comprehensive, high-quality, and lightweight learning hub.
- High Performance: eliminates the need for any backend server, running all math-heavy routines (including linear algebra solvers and signal processing) directly in the browser.
- Robustness and Quality: high code reliability is achieved with a strict static analysis pipeline (ESLint, Prettier, TypeScript) and comprehensive unit tests ensuring greater than 95% coverage on mathematical functions.
- Search and Filter Optimization: features a unified web hub allowing quick searching, category filtering (classification, regression, optimization, signal processing), and guided learning paths for self-directed study.