Context
Veona is a system monitoring platform designed and implemented from the collection agent to the visualisation layer. The goal: a lightweight, reproducible stack for collecting system metrics, storing them as time-series data, and detecting anomalies – without relying on any third-party cloud service.
Approach
The platform is organised into three separated planes:
- Data Plane (Go Agent): a single binary collects system metrics (CPU, memory, disk, network, GPU, temperatures, battery, entropy, NTP) via
gopsutil. Collectors run in independent goroutines, each with its own YAML-configurable interval. An in-memory ring buffer absorbs transient network outages, and an HTTP dispatcher pushes metrics compressed as GZIP to the server. - Control Plane (Hono / TypeScript Server): Bearer token validation, JSON-to-Prometheus transformation, token and anomaly persistence in SQLite via Drizzle, in-memory LRU cache to smooth ingestion spikes. A
node-cronscheduler drives periodic ML tasks. - Analytics Plane (ML Engine): six modules – Z-score anomaly detection on a sliding window, linear-regression forecasting of disk/memory/swap saturation, composite 0–100 health score, synthetic data auto-seeding, scheduler, and a PromQL client.
Key components
- Go Agent: plugin-based architecture, automatic disk discovery with filesystem-type exclusion policy, cross-platform build (Linux/Windows), central YAML configuration
- Hono Server:
rateLimiterandvalidateTokenmiddlewares typed via Hono context, Zod payload validation, structured JSON logger - Time-series storage: VictoriaMetrics with on-the-fly JSON→Prometheus conversion
- ML engine: Z-score (N=60, threshold 3.0) in real time at ingestion + batch every 30 s, linear regression on a 24 h window, weighted health score (anomalies à— forecasts à— zombies à— NTP drift)
- Deployment: full Docker Compose stack with Nginx reverse proxy, pre-configured Grafana dashboards,
GET /healthhealthcheck
Features
- Open source under MIT license, Go 1.22+ and Node.js 20+
- Reproducible: a single
docker-compose upstarts the entire stack - Extensible: add a new collector or ML module without modifying existing code
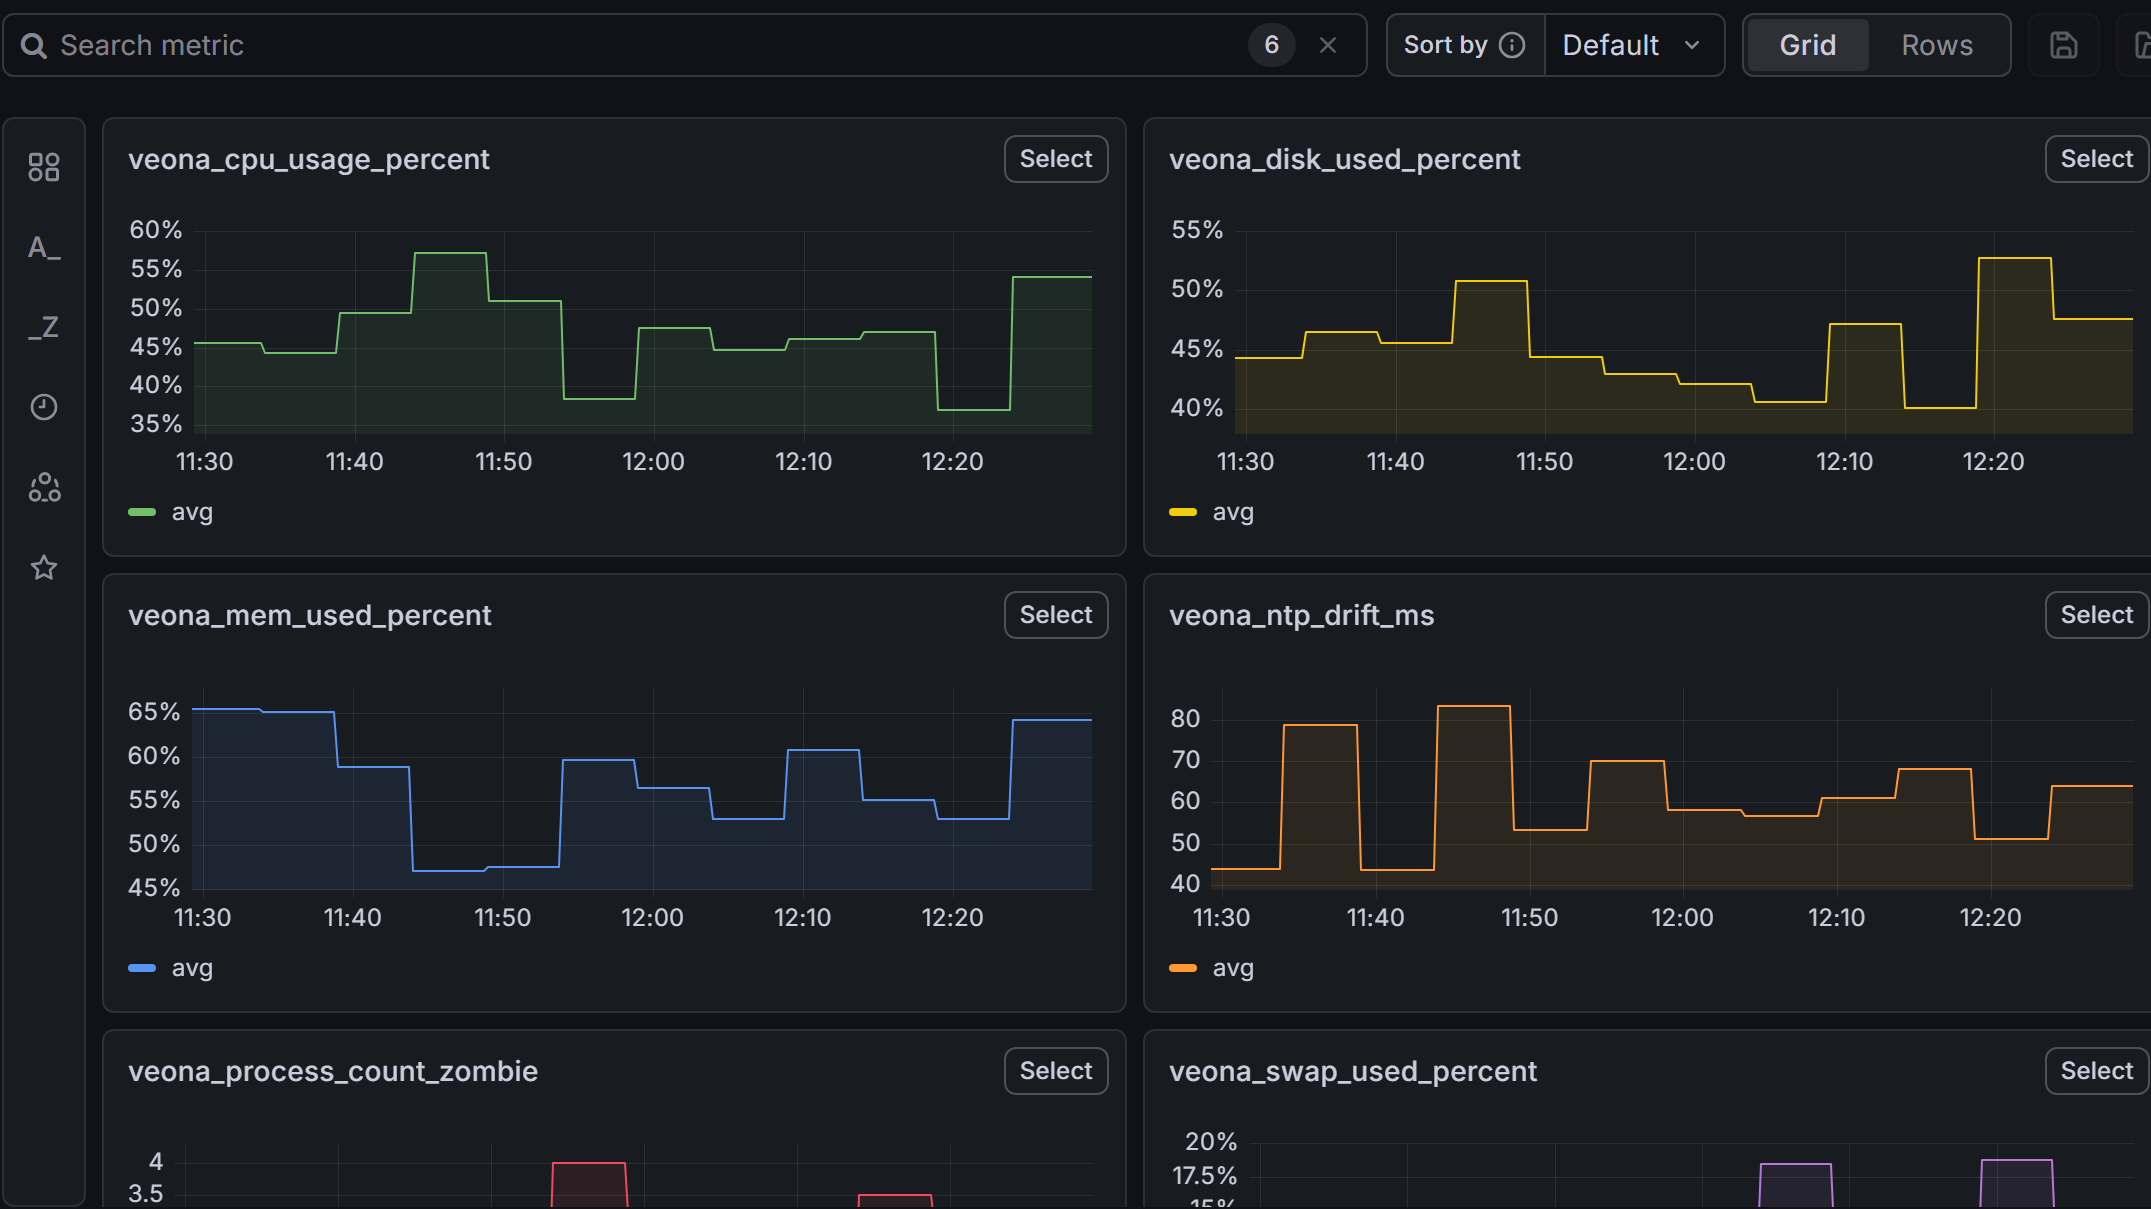
- Native observability: ML engine outputs are pushed as metrics (
veona_ml_*), queryable directly in Grafana
Technical notes
The project uses standard statistical algorithms (Z-score, linear regression) where heavier models would be disproportionate: inference latency stays below one millisecond, with no dependency on an external ML runtime.